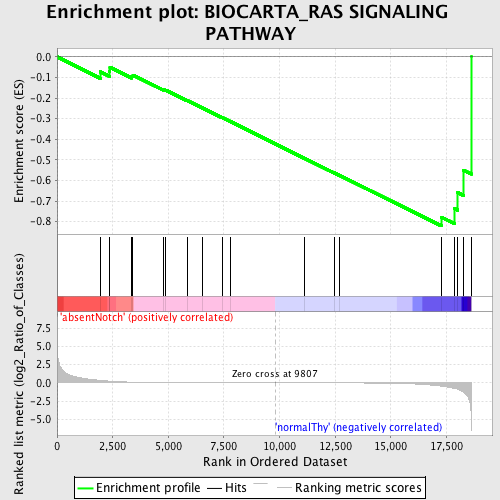
Profile of the Running ES Score & Positions of GeneSet Members on the Rank Ordered List
| Dataset | Set_03_absentNotch_versus_normalThy.phenotype_absentNotch_versus_normalThy.cls #absentNotch_versus_normalThy.phenotype_absentNotch_versus_normalThy.cls #absentNotch_versus_normalThy_repos |
| Phenotype | phenotype_absentNotch_versus_normalThy.cls#absentNotch_versus_normalThy_repos |
| Upregulated in class | normalThy |
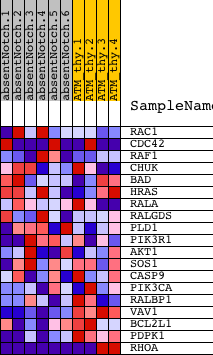
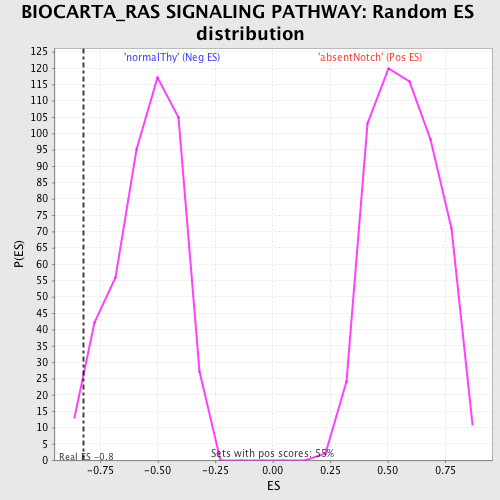
| GeneSet | BIOCARTA_RAS SIGNALING PATHWAY |
| Enrichment Score (ES) | -0.82104087 |
| Normalized Enrichment Score (NES) | -1.5039287 |
| Nominal p-value | 0.028571429 |
| FDR q-value | 0.2769681 |
| FWER p-Value | 0.992 |
| PROBE | DESCRIPTION (from dataset) | GENE SYMBOL | GENE_TITLE | RANK IN GENE LIST | RANK METRIC SCORE | RUNNING ES | CORE ENRICHMENT | |
|---|---|---|---|---|---|---|---|---|
| 1 | RAC1 | 4810687 | 1942 | 0.331 | -0.0721 | No | ||
| 2 | CDC42 | 1240168 3440278 4480519 5290162 | 2355 | 0.231 | -0.0717 | No | ||
| 3 | RAF1 | 1770600 | 2375 | 0.227 | -0.0506 | No | ||
| 4 | CHUK | 7050736 | 3349 | 0.094 | -0.0937 | No | ||
| 5 | BAD | 2120148 | 3409 | 0.089 | -0.0882 | No | ||
| 6 | HRAS | 1980551 | 4798 | 0.029 | -0.1600 | No | ||
| 7 | RALA | 2680471 | 4870 | 0.028 | -0.1611 | No | ||
| 8 | RALGDS | 430463 | 5840 | 0.016 | -0.2116 | No | ||
| 9 | PLD1 | 2450537 | 6534 | 0.011 | -0.2478 | No | ||
| 10 | PIK3R1 | 4730671 | 7437 | 0.007 | -0.2956 | No | ||
| 11 | AKT1 | 5290746 | 7797 | 0.006 | -0.3143 | No | ||
| 12 | SOS1 | 7050338 | 11108 | -0.004 | -0.4919 | No | ||
| 13 | CASP9 | 60577 1170368 2060576 | 12449 | -0.009 | -0.5631 | No | ||
| 14 | PIK3CA | 6220129 | 12684 | -0.010 | -0.5746 | No | ||
| 15 | RALBP1 | 4780632 | 17268 | -0.439 | -0.7782 | Yes | ||
| 16 | VAV1 | 6020487 | 17855 | -0.751 | -0.7365 | Yes | ||
| 17 | BCL2L1 | 1580452 4200152 5420484 | 18009 | -0.884 | -0.6585 | Yes | ||
| 18 | PDPK1 | 6650168 | 18263 | -1.250 | -0.5502 | Yes | ||
| 19 | RHOA | 580142 5900131 5340450 | 18613 | -5.837 | 0.0002 | Yes |